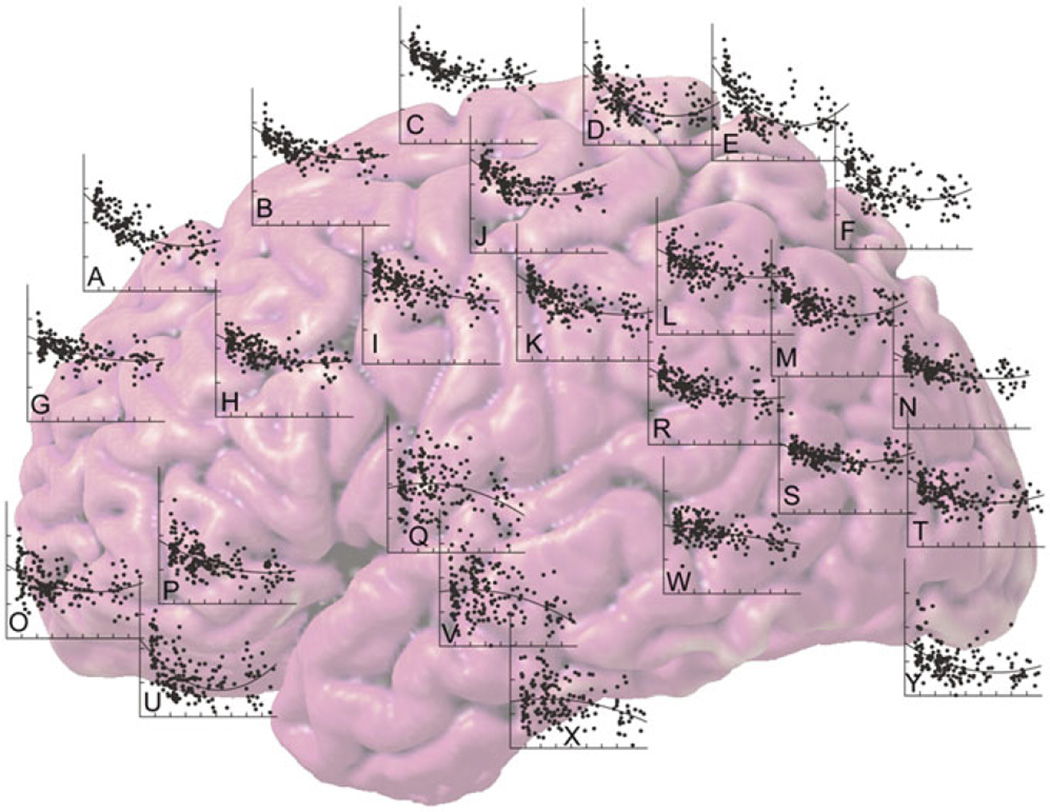
Fig. 1.
Cortical thickness shows regional and temporal specificity with development (Sowell et al. 2003). Shown is a surface rendering of the left hemisphere of the brain (anterior to posterior is left to right), with scatterplots of nonlinear relationship between gray matter density and age in years. Graphs are placed over the corresponding brain regions. All axes are identical; gray matter density is plotted on the x-axis, and age in years (range: 7–87 years) is plotted on the y-axis. Prefrontal and parietal regions show steeper or prolonged rates of decline compared to phylogenetically older regions like the occipital lobe. In contrast, temporal regions show increases in gray matter density before starting to decline in adolescence

