
Figure 3.
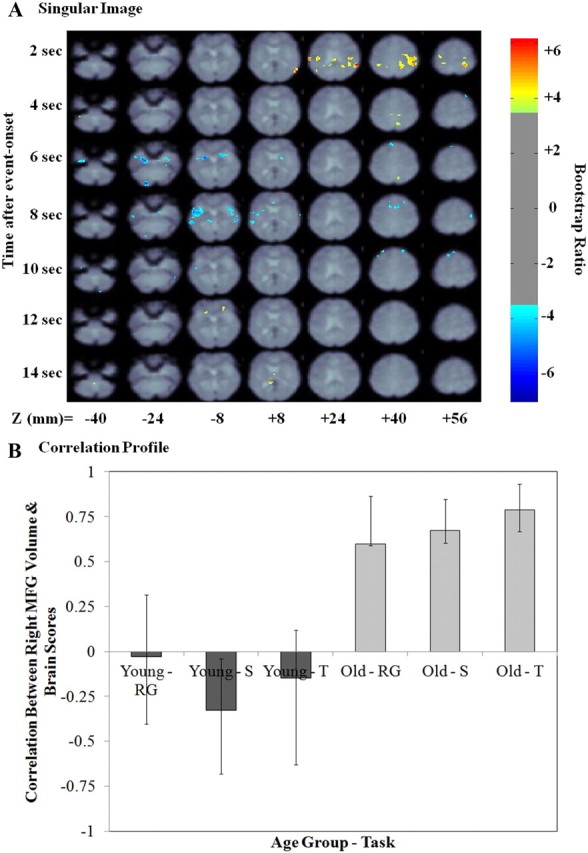
Right MFG volume PLS result—second LV. A, The singular image for LV2 at a bootstrap ratio of 3.5 (p < 0.0005), which reflects stable and significant activations at 2–14 s after event onset. The z coordinates are reported in millimeters in MNI space. The color bar represents the color code for the colorized activations on the singular image. Regions colored in red–orange–yellow are positively related with the experimental effect presented in B. Regions colored in blue are negatively related to the experimental effect presented in B. B, Correlation profile for LV2. The correlation profile shows how right MFG volume correlated with the pattern of brain activity identified in the singular image in young and older adults. RG, Recognition; S, spatial context; T, temporal context.