

Abstract
The structural and functional consequences of interindividual variations in cortical morphology are poorly understood. In this study, we examined the relationship between one well‐characterized variation of the medial frontal lobes, variability of the paracingulate sulcus (PCS), and grey matter volume, cortical thickness, surface area, and sulcal depth of the adjacent anterior cingulate cortex (ACC) and paracingulate cortex (PaC). Seventy‐seven healthy individuals were assigned to one of four groups depending on PCS incidence in both hemispheres: left‐present, right‐absent; left‐absent, right‐present; both absent; or both present. Comparing these groups on each measure yielded four primary findings: (1) The presence of a PCS was associated with increased PaC and decreased ACC grey matter volume in the hemisphere in which it was apparent, with an almost identical pattern being observed for surface area; (2) there was a more complex relationship between PCS variability and regional thickness, such that a PCS in the left hemisphere was associated with increased left PaC and right ACC thickness, with no comparable effects being observed for the presence of a right PCS; (3) the depths of all major left hemisphere sulci in the region were strongly positively correlated, whereas no such associations were apparent in the right hemisphere; and (4) a leftward asymmetry in PaC thickness was specifically associated with better performance on a test of spatial working memory ability. These results provide evidence for a complex interhemispheric relationship between sulcal variability and cortical morphometry, and indicate that such relationships may be important for understanding individual differences in cognitive abilities. Hum Brain Mapp, 2008. © 2007 Wiley‐Liss, Inc.
Keywords: MRI, gyrification, surface, prefrontal, VBM, executive
INTRODUCTION
No two brains possess exactly the same pattern of cortical convolutions, but the effects this variability has on regional morphometry and function are poorly understood. Located bilaterally in the medial frontal lobes, the anterior cingulate cortex (ACC) and paracingulate cortex (PaC) are well‐suited to investigations of such relationships as their morphological variability has been relatively well‐characterized [Paus et al., 1996a, b; Vogt et al., 1995; Yücel et al., 2001]. In particular, variability of the paracingulate sulcus (PCS), a tertiary sulcus that is present in approximately half of the healthy population and more commonly found (and more prominent) in the left hemisphere [Paus et al., 1996b; Yücel et al., 2001], has been shown to affect the cytoarchitecture [Vogt et al., 1995], volume [Fornito et al., 2006a; Paus et al., 1996a], and function [Artiges et al., 2006; Crosson et al., 1999; Fornito et al., 2004; Heckers et al., 2004; Yücel et al., 2002a] of the region in both healthy and clinical populations. Understanding how sulcal variability relates to the morphometry of these regions would facilitate accurate mapping of brain structure‐function relationships and characterization of ACC and PaC involvement in the pathophysiology of neurological and psychiatric disorders [Benes, 1996; Davidson et al., 2002; Drevets et al., 1998; Mega and Cummings, 1997; Miller et al., 2003].
When present, the PCS runs dorsal and parallel to the cingulate sulcus (CS). Postmortem work [Vogt et al., 1995] has shown that the presence of a PCS is associated with a relative expansion of the PaC (primarily area 32) such that it extends from the fundus of the CS across the crown of the paracingulate gyrus when a PCS is present, in contrast to being buried on the dorsal bank of the CS when a PCS is absent (Fig. 1). Using Magnetic Resonance Imaging (MRI), Paus et al. [1996a] found that the intrasulcal grey matter volume of the PCS negatively correlated with that of the CS, suggesting that ACC (primarily area 24) morphometry is also affected by PCS variability. More recently, we extended this work to examine total (not just intrasulcal) ACC and PaC grey matter volume and demonstrated that the presence of a PCS is associated with a mean volumetric increase of up to 88% in the PaC and a mean decrease of up to 39% in the ACC [Fornito et al., 2006a]. Functional imaging work has demonstrated that PCS variability can affect the exact location of activation foci elicited during cognitive tasks [Artiges et al., 2006; Crosson et al., 1999; Heckers et al., 2004; Yücel et al., 2002a], and we have found that individuals with a leftward PCS asymmetry (i.e., larger PCS in the left hemisphere), which is the most common pattern of folding in healthy populations [Paus et al., 1996b; Yücel et al., 2001], show better performance on tests of spatial working memory (SWM) and verbal fluency than those with a rightward asymmetric or symmetric pattern of folding [Fornito et al., 2004, 2006b]. Notably, this leftward asymmetry is less frequent in neuropsychiatric populations [Le Provost et al., 2003; Yücel et al., 2002b, 2003].
Figure 1.

Example of sulcal variability and corresponding region‐of‐interest (ROI) boundaries in a case with (A) an “absent” paracingulate sulcus (PCS) and “continuous” superior rostral sulcus (SRS) and (B) a “present” PCS and “separate” SRS. Left column presents a representative sagittal slice through the T1‐weighted image with major sulci marked in yellow. Middle column presents the reconstructed white matter (above) and pial (below) surfaces, again with the major sulci marked in yellow. The Sulci on the white matter surfaces are represented by indentations or “crevasses,” whereas gyri are represented by protrusions, or “ridges.” Right column presents the same white and pial surfaces with the six ROIs overlaid on top. The yellow lines correspond to the posterior border of the dorsal region (posterior line), the border between the dorsal and rostral regions (anterior line), and the posterior border of the subcallosal region (middle line inferior to genu). Following Vogt et al. [1995], the PaC was located in the dorsal bank of the cingulate sulcus (CS) in “absent” cases, and extended from the CS to the PCS in “present” cases. Accordingly, note how the PaC ROIs are not visible from the pial surface in case A, but are easily visualized on the white matter surface. See text for more details.
Together, this work provides compelling evidence that PCS variability affects the morphometry and function of the ACC and PaC. However, two limitations restrict the conclusions that can be drawn from some of these studies. First, our previous studies of PCS asymmetry and cognitive performance [Fornito et al., 2004, 2006b] did not obtain concurrent estimates of regional morphometry. Thus, it is unclear whether the relationship between PCS asymmetry and cognition was due to changes in the underlying grey matter or some other correlate of variability in local cortical folding [e.g., changes in regional connectivity, see Scannell, 1997; Van Essen, 1997]. Second, both our own [Fornito et al., 2006a] and Paus et al.'s [1996a] studies of the morphometric effects of PCS variability were only examined with respect to grey matter volume. Since a cortical region's volume is the product of its surface area and thickness, it is unclear whether the effects of PCS variability preferentially affected one parameter or the other.
To our knowledge, only two studies to date have examined how variations in cortical folding might be independently related to these morphometric indices. In one, Im et al. [2006] regressed estimates of the mean cortical thickness, mean sulcal depth, and the surface area of buried (i.e., sulcal) cortex (relative to total surface area) of each hemisphere against measures of its cortical complexity (an index of the degree of cortical folding across the entire hemisphere). They found strong positive correlations between surface area and complexity and negative correlations between thickness and complexity, consistent with other evidence that highly folded cortex tends to be associated with greater surface area and reduced thickness [Rakic, 1988; Welker, 1990]. In a separate study, Thompson et al. [Thompson et al., 2005] performed vertex‐based regression of hemispheric cortical complexity on cortical thickness maps of the medial and lateral cortical surfaces and found significant positive correlations in several specific brain regions, most prominently in a medial frontal area comprising the ACC and PaC. This implies there may be a regionally specific discontinuity in the normally negative correlation between folding and thickness that may have important functional consequences given these authors did not identify a similar relationship in patients with William's Syndrome. However, the relatively diffuse measure used to index cortical folding employed in these studies, which reduced the measure of hemispheric folding to a single number, makes it difficult to determine what the precise relationship between variations in convolutional patterns and cortical morphometry is.
In this study, we focused specifically on the relationship between PCS variability and ACC and PaC morphometry by classifying a large sample of healthy individuals on the basis of their PCS morphology in both hemispheres and comparing them on measures of regional grey matter volume, surface area, cortical thickness, and sulcal depth. These were estimated for separate ACC and PaC regions‐of‐interest (ROIs) by adapting a novel parcellation protocol [Fornito et al., 2006a] for use with cortical surface reconstructions [Dale et al., 1999; Fischl et al., 1999; Van Essen et al., 1998].
Our analyses were designed to examine both the “within‐hemisphere” and “between‐hemisphere” effects of PCS variability. The “within‐hemisphere” analysis examined the effect of simple presence or absence of the PCS on regional morphometry in each hemisphere separately. On the basis of previous work [Fornito et al., 2006a; Paus et al., 1996a; Vogt et al., 1995], we expected that the presence of a PCS within each hemisphere would be associated with increased PaC and decreased ACC volume and surface area, and that this would be most pronounced in dorsal and rostral regions (i.e., the areas through which the PCS passes). In contrast, we expected a PCS to be associated with increased thickness in both the PaC and ACC, given Thompson et al.'s [2005] findings. We also we expected a PCS to be associated with a shallower CS, in light of previous qualitative observations noted in postmortem specimens [Ono et al., 1990; Vogt et al., 1995].
The “between‐hemisphere” analysis examined the effects of PCS asymmetries across both hemispheres. In light of the aforementioned evidence that a leftward PCS asymmetry is the most frequent pattern observed in healthy populations [Paus et al., 1996a; Yücel et al., 2001]; that it is associated with better executive cognitive performance [Fornito et al., 2004, 2006b]; and that is less frequent in neuropsychiatric populations [Le Provost et al., 2003; Yücel et al., 2002b, 2003]; we expected that individuals with a leftward PCS asymmetry would show a distinctive pattern of morphometric changes when compared with rightward asymmetric or symmetric individuals. As a secondary analysis, we extended our previous findings demonstrating a relationship between PCS asymmetries and performance on tests of executive cognition by examining whether asymmetries in grey matter volume, surface area, or cortical thickness might account for this association.
METHOD
Participants
The sample comprised 77‐right‐handed individuals (49 male, 28 female) free of any personal or family history of psychiatric or neurological disorder recruited as part of ongoing research being conducted at our centres. There were no significant differences between males and females with respect to age (median age for males = 23.29 years, range = 16.19–51.72 years; median age for females = 25.14 years, range = 16.59–54.45 years; Mann–Whitney U = 624.500, P = 0.515). Handedness was assessed with the Edinburgh Handedness Inventory [Oldfield, 1971]. All participants gave written informed consent, prior to taking part, in accordance with local ethics committee guidelines.
Magnetic Resonance Imaging
Image acquisition
Scans were acquired using a GE Signa 1.5 Tesla scanner at the Royal Melbourne Hospital, Victoria, Australia. A three‐dimensional volumetric SPGR sequence generated 124 contiguous coronal slices. Imaging parameters were as follows: time‐to‐echo, 3.3 ms; time‐to‐repetition, 14.3 ms; flip angle, 30°; matrix size, 256 × 256; field of view, 24 × 24 cm2; voxel dimensions, 0.938 × 0.938 × 1.5 mm3. MRI data were transferred from DAT tape to an SGI‐02 workstation and coded to ensure participants confidentiality and blinded rating. Data was subsequently transferred to a Linux Debian 3.1 workstation for the bulk of image processing.
Image Preprocessing
Prior to classifying the PCS and other morphological variations relevant to the parcellation scheme (see later), each participants' image was stripped of extracerebral tissue [Smith, 2002] and aligned to the N27 template [Holmes et al., 1998] via a 6° rigid‐body transformation [Jenkinson and Smith, 2001] using tools contained in the FSL software package (http://www.fmrib.ox.ac.uk/fsl). No scaling or warping was performed during this alignment, although the images were resampled to 1 mm3 voxels. Concurrently, a number of other preprocessing steps were performed in preparation for surface reconstruction (described later).
Classification of Sulcal Variability
Two major morphological variations were classified on the N27‐aligned images in Analyze 6.0 (Mayo Software) to aid identification of ROI boundaries; the incidence and extent of the PCS and the confluence of the CS with the superior rostral sulcus (SRS). Detailed descriptions of the classification protocol used can be found elsewhere [Fornito et al., 2006a; Yücel et al., 2001]. Briefly, the PCS was classified as “present” if there was a clearly identifiable sulcus running dorsal and parallel to the CS for ≥3 consecutive sagittal slices that was at least 20 mm in length. If the sulcus was ≥40 mm, a classification of “prominent” was made, unless there was >20 mm of gaps (in total) in the rostro–caudal course of the PCS, in which case it was labeled “present.” If there was no clearly identifiable sulcus parallel to the CS for ≥20 mm, a classification of “absent” was made. “Present” and “prominent” cases were collapsed into one category (i.e., “present”) for current purposes (see later). Intra‐ and inter‐rater reliabilities (kappa) for this method have been assessed on 20 randomly selected cases. Intra‐rater reliabilities were 0.99 and 0.83, while inter‐rater reliabilities were 0.89 and 0.90, for the left and right hemispheres, respectively.
For the SRS, a classification of “continuous,” was made if its main body was connected to the anterior limit of CS for ≥3 sagittal slices, which usually occurred prior to the CS arching inferior and posterior to the genu. All other cases were classified as “separate.” Guidelines for identifying “separate” and “continuous” cases, and distinguishing between the CS, SRS, and inferior rostral sulcus (IRS), were derived from examples provided by Ono et al. [1990, p.119]. Examples of each classification are presented in Figure 1.
Cortical Surface Reconstruction
The white and pial surfaces (Fig. 1) of the entire cortical ribbon were reconstructed from the raw unaligned images (which were used to minimize the effects of unnecessary interpolation and/or resampling) using methods described in detail by Fischl, Dale, and colleagues [Dale et al., 1999; Fischl and Dale, 2000; Fischl et al., 1999], and as implemented in the Freesurfer software package (http://surfer.nmr.mgh.harvard.edu). This surface‐based approach enabled calculation of grey matter volume, surface area, and cortical thickness separately for each region (see online supporting material for more detail).
Regional Parcellation of the Anterior Cingulate and Paracingulate Cortices
We adapted our previously described protocol for volumetric parcellation of the ACC and PaC [Fornito et al., 2006a] to be used with cortical surface reconstructions. Briefly, converging evidence from neurophysiological, neuroimaging, lesion, and nonhuman primate studies, indicates that the ACC and PaC can be divided into a caudal “motor” region (not investigated in this study, as the PaC rarely extends into this region), dorsal “cognitive” region (d‐ACC and d‐PaC), a rostral “affective” region (r‐ACC and r‐PaC), and a subcallosal area (sub‐ACC and sub‐PaC) primarily involved in the autonomic and experiential aspects of emotion, particularly negative emotional states [Amodio and Frith, 2006; Bush et al., 2000; Devinsky et al., 1995; Drevets et al., 1997; Fornito et al., 2006a; Phan et al., 2002; Picard and Strick, 1996; Ridderinkhof et al., 2004; Steele and Lawrie, 2004]. Our approach attempts to delineate each of these regions in accordance with variations in sulcal anatomy, with reference to cytoarchitectonic research [Vogt et al., 1995]. The ACC was always delineated as the grey matter between the fundus of the callosal sulcus and that of the CS. Following Vogt et al.'s [1995], postmortem work, we identified the PaC as the grey matter between the fundus of the CS and PCS if the PCS was “present,” and as the grey matter on the dorsal bank of the CS if the PCS was “absent.” Since “separate” cases (i.e., individuals in whom the CS does not connect to the SRS) show a similar “double‐folded” pattern in the subgenual portion of the rostral region, the PaC was also assumed to extend across to the fundus of the SRS in such cases. For “continuous” cases, the PaC in this region was located on the outer bank of the CS (i.e., the rostral and ventral bank as it arches underneath the genu). Such relationships are suggested by contrasting maps presented by Devinsky et al. [1995] and Vogt et al. [1995], and are illustrated in Figure 1. The border separating the dorsal and caudal regions was taken as a coronal plane through the anterior commissure; the border between the dorsal and rostral regions was taken as a coronal plane through the genu of the corpus callosum; and the posterior border of the subcallosal region was adapted from the work of Drevets et al. [1997]. Additional details can be found in the online supplementary material.
ROIs were parcellated on smoothed representations of the reconstructed white matter surfaces (Fig. 1) using tools contained in Freesurfer. The white matter surface “opens‐up” medial wall sulci and facilitates tracing along sulcal depths and banks without introducing the distortions inherent in other surface representations, such as inflated surfaces or flat maps [Fischl et al., 1999; Van Essen, 2005]. The T1‐weighted volume was visualized simultaneously to guide landmark identification and ROIs were projected onto the pial surface to check for accuracy and consistency prior to continuing.
Sulcal Depth
Depth estimates for the CS, PCS, and SRS were calculated using Caret 5.2 (http://brainmap.wustl.edu/vanessen.html). The freesurfer‐generated white and pial surfaces were imported into Caret and averaged to produce an intermediate surface that ran parallel to, and half‐way in between, the white and pial surfaces. This intermediate surface facilitated tracing on the gyral crowns bordering each sulcus (which appear as quite thin on the white matter surface), while still opening the sulci up enough to allow appropriate boundary delineation (which is not possible on the pial surface). The methods used to generate a depth map of the cortical surface are described in detail by Van Essen [2005]. Figure 2 illustrates the steps involved in calculating sulcal depth for each sulcus of interest in the current study.
Figure 2.

Steps used to calculate sulcal depth. The white and pial surfaces were averaged to create an intermediate surface that ran halfway through the cortical ribbon (the result is show in the top left). Multiple dilation and erosion operations were then applied to this surface to obtain a model of the cerebral hull (top middle). The geodesic distance from the hull to each point on the intermediate surface was measured (in mm) to produce a depth map of the entire surface [top right; see Van Essen, 2005, for more details]. Inclusive borders were delineated along the gyral crowns abutting the cingulate, paracingulate, and superior rostral sulci (CS, PCS, and SRS, respectively; bottom left). Beginning at the hull (i.e., 0 mm) and progressing deeper in increments of 0.5 mm, a threshold was set on the depth map of each individual to create a mask that comprised only buried cortex (i.e., cortex on gyral crowns was excluded; bottom middle). The thresholded mask was then applied to the inclusive sulcal traces to yield regions comprising only cortex buried in each sulcus (bottom right). In this regard, our depth measures are similar in principle to those described by Rettmann et al. [2006].
Intracranial volume
Intracranial volume (ICV) was calculated for each individual to control for any group differences in brain size using a previously described method [Eritaia et al., 2000]. Inter‐rater and intra‐rater reliabilities for this method have previously been shown to be 0.99.
Cognitive Measures
To examine how regional morphometry relates to cognitive abilities, we assessed performance on two tasks previously shown to be related to PCS asymmetry [Fornito et al., 2004]; the SWM of the Cambridge Automated Neuropsychological Test Battery (CANTAB) [Owen et al., 1990, 1996 and the Controlled Oral Word Association Test (COWAT) [Spreen and Strauss, 1998], which was used to assess verbal fluency (VF) performance. (More detailed descriptions of these measures can be found on the online supplementary material.) This analysis was performed in a subset of the current study group for which performance data were available (39 male and 23 female participants for the SWM task; 27 male and 9 female for the VF task). This represents an extension of the sample examined in our previous work [Fornito et al., 2004]. Intelligence quotients (IQ) were estimated using the National Adult Reading Test (NART) [Nelson and Willison, 1991].
Statistical Analyses
To maximize statistical power, “prominent” and “present” cases were collapsed to form a binary PCS classification of “present” or “absent.” Individuals were then grouped according to the four possibilities that can arise by comparing such a classification across the two hemispheres: “present” in the left and “absent” in the right (P/A; 17 males, 6 females); “present” in both hemispheres (P/P; 18 males, 5 females); “absent” in both hemispheres (A/A; 7 males, 7 females); and “absent” in the left and “present” in the right (A/P; 7 males, 10 females). These groups did not differ with respect to age [Kruskal‐Wallis χ2 = 0.732, P = 0.866] or NART‐IQ [F(3, 65) = 0.484, P = 0.695; performance data not available for eight participants].
Regional grey matter volumes, cortical thickness, and surface area were analyzed with mixed within‐ and between‐subjects ANOVA, with hemisphere (left or right), region (dorsal, rostral, and subcallosal), and cortex (ACC or PaC) as within‐subjects factors, and PCS group (P/A, P/P, A/A, or A/P) and sex (male or female) as between‐subjects factors. CS sulcal depth was analyzed in a similar fashion except hemisphere was the only repeated‐measure. PCS and SRS depth were not analyzed using ANOVA, since they were not apparent in all cases. Main effects and interactions were evaluated using Greenhouse‐Geisser corrected degrees of freedom (sphericity assumptions were invariably violated) with α = 0.05. Model adequacy was checked through standard assumption tests and graphical displays [Behrens, 1997]. No overly influential data points were detected in any of the analyses, as assessed using Cook's D, a measure of the influence an outlying value exerts on the analysis.
As previously stated, the analysis was designed to address two aims. The first was to examine the “within‐hemisphere” effects of PCS variability on regional morphometry. These were investigated using planned contrasts comparing those with and without a left PCS on left hemisphere measures (i.e., the average of the P/A and P/P groups vs. the average of the A/A and A/P groups), and those with and without a right PCS on right hemisphere measures (i.e., the average of the P/P and A/P group vs. the average of the A/A and P/A groups). Thus, this analysis examined the effect of a PCS on regional morphometry within the hemisphere in which it was apparent, irrespective of PCS variations in the other hemisphere. As these were planned a priori, they were evaluated against α = 0.05.
Our second aim was to investigate “between‐hemisphere” effects by considering the influence of PCS asymmetry on ACC and PaC morphometry in both hemispheres. These were evaluated using posthoc pairwise contrasts comparing the P/A, P/P, A/A, and A/P groups wherever group was involved in a significant effect. This allowed us to investigate how the presence or absence of the PCS across both hemispheres affected regional measures bilaterally. As we had no strong predictions regarding the nature of these differences, these contrasts were evaluated using a Bonferroni‐adjusted significance level to correct for multiple comparisons. To facilitate interpretation, the correction factor (i.e., the number of contrasts per set) was multiplied by the P value for each family of contrasts so that results reported as P < 0.05 are significant at the corrected level. Corresponding effect sizes, expressed as Cohen's d, are also reported. Only effects involving the between‐subject factors are reported as these were the effects of primary interest. For the same reason, if a main effect or interaction formed part of a higher order interaction, only the higher order effect and its posthoc decomposition are reported.
Initial analyses revealed that ICV was a significant covariate for grey matter volume [F(1, 68) = 19.805, P < 0.0001], surface area [F(1, 68) = 27.482¡ P < 0.0001], and sulcal depth [F(1, 68) = 9.055, P = 0.022], but not cortical thickness [F(1, 68) = 0.725, P = 0.398]. Further inspection of results indicated that ICV interacted with several of the volume and surface area variables, suggesting violation of ANCOVA homogeneity of regression assumptions for these two measures. We therefore corrected grey matter volume and surface area estimates for ICV using equations reported by Free et al. [1995]. As no interactions with ICV were evident in the model for sulcal depth, ICV was retained as a covariate for this analysis. No covariates were employed in the analysis of cortical thickness.
Associations between morphometric measures and VF performance were assessed using Pearson's r, as were interrelationships between sulcal depth measures, which were tested against a Bonferroni‐adjusted α to correct for multiple comparisons. As SWM performance was measured in errors, the resulting variable displayed a negative binomial distribution that violates the assumptions of most traditional parametric analyses [Gardner et al., 1995]. We therefore used negative binomial regression [Liang and Zeger, 1986; Zeger and Liang, 1986], as implemented in STATA 8.0, to determine whether ACC and/or PaC morphometric indices were significant predictorsof SWM performance. All other analyses were performed using SPSS 12.0 for Windows.
RESULTS
Reliabilities
Intra‐ and inter‐rater reliabilities for each ROI are presented in Table I. As can be seen, most intraclass correlation coefficients are >0.90, with none <0.80. For sulcal depth measures, the reliabilities were as follow (intrarater/interrater): 0.95/0.97 for the left CS; 0.96/0.97 for the left PCS; 0.98/0.98 for the left SRS; 0.91/0.84 for the right CS; 0.92/0.93 for the right PCS; and 0.87/0.84 for the right SRS.
Table I.
Intra‐ and inter‐rater reliabilities for each ACC/PaC subregion
| r‐ACC | r‐PaC | d‐ACC | d‐PaC | sub‐ACC | sub‐PaC | |
|---|---|---|---|---|---|---|
| Cortical Thickness | ||||||
| Intra‐rater ICC (L/R) | 0.98/0.99 | 0.96/0.97 | 0.98/0.99 | 0.95/0.96 | 0.97/0.94 | 0.90/0.94 |
| Inter‐rater ICC (L/R) | 0.97/0.97 | 0.98/0.95 | 0.99/0.99 | 0.99/0.92 | 0.96/0.94 | 0.96/0.97 |
| Surface Area | ||||||
| Intra‐rater ICC (L/R) | 0.97/0.94 | 0.98/0.96 | 0.97/0.98 | 0.98/0.96 | 0.94/0.92 | 0.91/0.89 |
| Inter‐rater ICC (L/R) | 0.99/0.99 | 0.94/0.90 | 0.97/0.97 | 0.95/0.87 | 0.81/0.95 | 0.87/0.93 |
ICC, intra‐class correlation coefficient; L, left hemisphere; R, right hemisphere; r‐ACC and r‐PaC, rostral anterior cingulate cortex and rostral paracingulate cortex, respectively; d‐ACC and d‐PaC, dorsal anterior cingulate cortex and dorsal paracingulate cortex, respectively; sub‐ACC and sub‐PaC, subcallosal anterior cingulate cortex and subcallosal paracingulate cortex, respectively.
ICCs for grey matter volume are not reported, as this measure is derived from thickness and surface area. ICCs for sulcal depth reported in text.
Grey Matter Volume
Within‐hemisphere effects
The analysis revealed a significant hemisphere × region × cortex × PCS interaction [F(4.269, 98.176) = 9.141, P < 0.0001]. There was no two‐way sex × PCS interaction [F(3, 69) = 0.299, P = 0.826], and sex did not interact with PCS in any higher‐order effects. As predicted, planned contrasts for the “within‐hemisphere” analysis revealed that individuals with a PCS in the left hemisphere had significantly larger left PaC volume and significantly smaller left ACC volume than those without a left PCS [F(1, 69) = 62.073, P < 0.0001 and F(1, 69) = 35.670, P < 0.0001, respectively]. Similarly, individuals with a right PCS displayed significantly larger right PaC volume and smaller right ACC volume than those without a right PCS [F(1, 69) = 72.754, P < 0.0001 and F(1, 69) = 17.543, P < 0.0001, respectively]. However, the aforementioned 4‐way interaction indicated that these findings varied across the dorsal, rostral, and subcallosal regions. As can be seen in Figure 3, the effects were most pronounced in the dorsal and rostral regions, and were not as apparent in the subcallosal ROIs. Group means and standard deviations for each measure are presented in the online supplementary table.
Figure 3.

Mean grey matter volume (top row in mm3) and surface area (bottom row, in mm2) estimates for all six left hemisphere (left column) and right hemisphere (right column) regions, corrected for intracranial volume. In the left column, solid lines represent the groups with a left PCS and dotted lines represent groups without a left PCS. In the right column, solid lines represent groups with a right PCS and dotted lines represent groups without a right PCS. Squares represent groups that have an asymmetric PCS, triangles groups with a symmetric PCS. Error bars are not presented for ease of visualization. Standard deviations around the means are presented in the online supplementary table.
Between‐hemisphere effects
The results of the “between‐hemisphere” analysis are summarized in Table II. Effect sizes are presented instead of F‐ratios because they allow standardized assessment of the magnitude of the differences. As can be seen, the findings in the left hemisphere mirrored the “within‐hemisphere” findings to the extent that individuals with a left PCS (i.e., P/A and P/P) showed greater PaC and less ACC volume than those without a left PCS (A/A and A/P individuals), particularly in the dorsal and rostral regions. The only exception to this rule was the P/P group in the r‐ACC, who showed no significant differences relative to the other three groups (although the effect sizes relative to the A/A and A/P groups can still be considered as large; Cohen, 1992]. The only significant differences in the subcallosal ROIs indicated that leftward asymmetric individuals (the P/A group) showed less left sub‐ACC volume than both groups without a left PCS (i.e., A/A and A/P individuals).
Table II.
Effect sizes (Cohen's d) for each pairwise contrast in the “between‐hemisphere” analysis of regional grey matter volume
| d‐ACC | d‐PaC | r‐ACC | r‐PaC | sub‐ACC | sub‐PaC | |
|---|---|---|---|---|---|---|
| Left | ||||||
| P/A–P/P | −0.40 | <0.01 | −0.66 | 0.29 | −0.41 | 0.29 |
| P/A–A/A | −2.12a | 1.49a | −1.71a | 2.09a | −1.20b | 0.26 |
| P/A–A/P | −1.66a | 1.48a | −1.80a | 1.97a | −1.40b | 0.78 |
| P/P–A/A | −1.12a | 1.54a | −0.86 | 1.37a | −0.61 | 0.00 |
| P/P–A/P | −0.82a | 1.52a | −0.99 | 1.30a | −0.69 | 0.48 |
| A/A–A/P | 0.41 | −0.15 | −0.16 | −0.10 | −0.03 | 0.44 |
| Right | ||||||
| P/A–P/P | 1.11b | −1.65a | 0.52 | −1.64a | 0.35 | −0.62 |
| P/A–A/A | −0.63 | 0.05 | 0.33 | 0.31 | 0.06 | −0.04 |
| P/A–A/P | 0.86 | −1.95a | 1.72a | −1.53a | 0.88 | −0.34 |
| P/P–A/A | −1.76a | 1.58a | −0.18 | 1.81a | −0.25 | 0.54 |
| P/P–A/P | −0.08 | −0.30 | 1.13 | 0.39 | 0.38 | 0.32 |
| A/A–A/P | 1.35a | −1.83a | 1.36a | −1.83a | 0.71 | −0.27 |
ACC, anterior cingulate cortex; PaC, paracingulate cortex; d‐, r‐, and sub‐ denote dorsal, rostral, and subcallosal regions, respectively.
P < 0.01, corrected.
P < 0.05, corrected.
The findings in the right hemisphere were similar to those in the left and were also congruent with the “within‐hemisphere” analysis, to the extent that individuals with a right PCS (the P/P and A/P groups) showed larger PaC and smaller ACC volume in dorsal and rostral regions when compared to those without a right PCS (the P/A and A/A groups). The only exceptions to this rule were that P/A individuals were not significantly different from A/P individuals in the d‐ACC (although the effect size was still quite large), and that P/P individuals showed comparable r‐ACC surface area to the two groups without a right PCS (i.e., the P/A and A/A groups). No significant group differences were identified in right subcallosal regions.
Surface Area
Within‐hemisphere effects
As with grey matter volume, the analysis of surface area revealed a significant hemisphere × region × cortex × PCS interaction [F(4.361, 100.309) = 8.452, P < 0.0001]. There was no sex × PCS interaction [F(3, 69) = 0.522, P = 0.668], and sex did not interact with PCS in any higher‐order effects. As predicted, planned contrasts revealed that individuals with a left PCS displayed greater left PaC surface area and less left ACC surface area than individuals without a left PCS [F(1, 69) = 52.801, P < 0.0001, and F(1, 69) = 35.454, P < 0.0001, respectively]. Similarly, individuals with a right PCS displayed greater right PaC and less right ACC surface area relative to those without a right PCS [F(1, 69) = 20.948, P< 0.0001 and F(1, 69) = 64.420, P < 0.0001, respectively]. As with grey matter volume, however, the aforementioned 4‐way interaction indicated this was less pronounced in the subcallosal regions (Fig. 3).
Between‐hemisphere effects
Results of the “between‐hemisphere” analysis for surface area are summarized in Table III. In the left hemisphere, the pattern of significant differences was virtually identical to that identified for grey matter volume, except there were no differences in the surface area of subcallosal regions. Group differences in the right hemisphere were also nearly identical to those identified for grey matter volume, the only exception being that leftward asymmetric (i.e., P/A individuals) were not significantly different from any of the groups in the d‐ACC (although the effect sizes relative to each group were in the large range).
Table III.
Effect sizes (Cohen's d) for each pairwise contrast in the “between‐hemisphere” analysis of regional surface area
| d‐ACC | d‐PaC | r‐ACC | r‐PaC | sub‐ACC | sub‐PaC | |
|---|---|---|---|---|---|---|
| Left | ||||||
| P/A–P/P | −0.37 | −0.01 | −0.69 | 0.25 | 0.06 | 0.19 |
| P/A–A/A | −1.86a | 1.49a | −1.68a | 1.81a | −1.19 | 0.11 |
| P/A–A/P | −1.71a | 1.42a | −1.75a | 1.70a | −1.15 | 0.53 |
| P/P–A/A | −0.97a | 1.49a | −0.84 | 1.26a | −1.06 | −0.07 |
| P/P–A/P | −0.81a | 1.41a | −0.95 | 1.19a | −1.05 | 0.32 |
| A/A–A/P | 0.28 | −0.31 | −0.13 | −0.13 | −0.03 | 0.36 |
| Right | ||||||
| P/A–P/P | 0.97 | −1.56a | 0.76 | −1.51a | 0.31 | −0.53 |
| P/A–A/A | −0.75 | −0.14 | 0.23 | 0.30 | −0.23 | −0.02 |
| P/A–A/P | 0.77 | −2.14a | 1.72a | −1.30a | 0.58 | −0.30 |
| P/P–A/A | −1.73a | 1.39a | −0.49 | 1.78a | −0.47 | 0.50 |
| P/P–A/P | ‐0.08 | −0.44 | 0.86 | 0.40 | 0.20 | 0.28 |
| A/A–A/P | 1.38a | −1.91a | 1.39a | −1.71a | 0.70 | −0.28 |
ACC, anterior cingulate cortex; PaC, paracingulate cortex; d‐, r‐, and sub‐ denote dorsal, rostral, and subcallosal regions, respectively.
P <0.01, corrected.
Cortical Thickness
Within‐hemisphere effects
There was a significant interaction between sex and hemisphere [F(1, 69) = 9.008, P = 0.004], with posthoc contrasts indicating that males had thicker cortex than females in all left hemisphere regions (d =0.614, P = 0.011). There was no sex × PCS interaction [F(3, 69) = 1.771, P = 0.161], and sex did not interact with PCS in any higher‐order effects. There was a significant hemisphere × cortex × PCS interaction [F(3, 115.249) = 7.592, P < 0.0001], but in contrast to grey matter volume and surface area, planned contrasts revealed only one significant effect; that the presence of a left PCS was associated with increased left PaC thickness [F(1, 69) = 11.639, P = 0.001, d = 0.857] with no effect on left ACC thickness [F(1, 69) = 2.597, P = 0.111, d = −0.334], and there were no significant differences between individuals with and without a right PCS with respect to either right PaC or right ACC thickness [F(1, 69) = 1.711, P = 0.195, d = 0.300 and F(1, 69) = 0.405, P = .527, d = −0.255, respectively]. This is illustrated in Figure 4.
Figure 4.
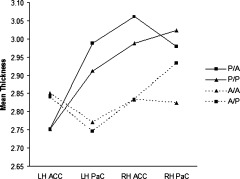
Mean thickness estimates for the left (LH) and right (RH) anterior cingulate cortex (ACC) and paracingulate cortex (PaC) for each PCS group, collapsed across dorsal, rostral, and subcallosal regions. Solid lines represent groups with a left PCS, dotted lines those without a left PCS. Squares represent groups showing a PCS asymmetry and triangles those with a symmetric PCS classification. Error bars are not presented for ease of visualization. Standard deviations around the means are presented in the online supplementary table.
Between‐hemisphere effects
The “between‐hemisphere” analysis indicated that leftward asymmetric individuals (the P/A group) individuals had a thicker left PaC and right ACC than both groups without a left PCS (vs. A/A: d = .897, P = .049 and d = .917, P = 0.041, respectively; and vs. A/P: d = .996, P = 0.014 and d =.921, P = 0.028, respectively), but did not differ significantly from P/P individuals on any measure. There were also no significant differences between P/P individuals and either the A/A or A/P groups in any region (Fig. 4).
One reason for the increased PaC thickness in “present” relative to “absent” cases may be that proportionally more gyral crown cortex is included in the ROI for the former group. Since cortex on the gyral crown tends to be thicker than cortex in the sulcal fundus [Fischl and Dale, 2000; Welker, 1990], including more crown cortex in the ROI may have elevated estimates of mean cortical thickness. To evaluate this further, we examined the “within‐hemisphere” effects of a PCS on thickness only in the sulcal areas of the PaC regions by thresholding the ROIs using the depth map obtained for calculating sulcal depth. This revealed a trend for a left PCS to still be associated with increased left PaC thickness (d = 0.435, P = 0.077), with no other differences approaching statistical significance.
An additional potential confound explaining why a left PCS was associated with increased left PaC thickness, without a similar relationship being observed in the right, may be that the PCS, if apparent, it is typically larger in the left [Yücel et al., 2001]. This was indeed the case in the current sample; in the P/A group, 18/23 (78%) left PCS classifications were “prominent,” whereas 8/17 (47%) right PCS classifications were “prominent” in the A/P group. In the P/P group, 13/23 (57%) left PCS classifications were “prominent,” whereas only 8/23 (35%) right PCS classifications were “prominent.” We examined the potential impact of this effect by collapsing across PCS groups and comparing the left PaC thickness of individuals assigned a “present” PCS classification with those assigned a “prominent” PCS classification, and conducted a similar analysis for right PCS classifications and right PaC thickness. This analysis identified no significant differences between individuals classified as “present” versus “prominent” in either the left or right hemispheres [t(44) = −1.324, P = 0.192 and t(44) = −0.701, P = 0.485, respectively].
Sulcal Depth
There was no significant main effect of PCS [F(3, 68) = 0.645, P = 0.589], sex [F(1, 68) = 0.741, P = 0.506], or PCS × sex interaction [F(3, 68) = 0.455, P = 0.714], on CS depth, nor was there a main effect of hemisphere [F(1, 68) = 0.254, P = 0.616], or interaction between hemisphere and either of the between‐subjects variables. Pairwise correlations between sulcal depth measures revealed each left hemisphere sulcus to be strongly and significantly positively correlated with each other; CS depth was correlated with left PCS (r = 0.629, P < 0.0001, corrected) and left SRS (r = 0.723, P < 0.0001, corrected) depth, as were the depths of the left PCS and SRS (r = 0.793, P < 0.0001, corrected). In contrast, there was no significant correlation between depths of the right CS and PCS (r = −0.392, P = 0.195, corrected), right CS and SRS (r = 0.082, P > 0.99, corrected), or right PCS and SRS (r = 0.309, P > 0.99, corrected). No left hemisphere depth measures were correlated with those in the right hemisphere.
Morphometric Associations with Cognition
In light of our previous finding that a leftward PCS asymmetry was associated with better SWM and VF performance [Fornito et al., 2004], and our current findings indicating that a PCS in the left hemisphere is associated with both a thicker left PaC and right ACC, we reasoned that the effect of PCS morphology on cognition could result from left–right asymmetries in either ACC or PaC morphometry. As such, we created a left–right morphometric asymmetry index [(left − right)/(left + right); thus, negative values indicate a rightward asymmetry] for the ACC and PaC cortices separately and tested these for an association with cognitive performance measures. This was done to restrict our search‐space for pairwise associations and minimize the number of statistical tests performed.
PaC thickness asymmetry was a significant predictor of SWM performance (z = −2.11, P = 0.035), whereas ACC thickness asymmetry was not (z = 0.50, P = 0.616). Neither ACC nor PaC asymmetries in either surface area or volume were significant predictors of SWM performance, and no associations were found between any morphometric asymmetry variables and VF performance (data not shown).
DISCUSSION
The primary aim of this study was to investigate the morphometric consequences of PCS variability and how this, in turn, relates to cognitive abilities. There were four primary findings; (1) PCS variability influenced ACC and PaC grey matter volume in a predictable manner that was largely due to the surface area used to define the regions, as previously demonstrated in a less representative sample [Fornito et al., 2004]; (2) the relationship between PCS variability and regional cortical thickness was more complicated than that with volume or surface area, with a left PCS specifically being associated with a distinct pattern of bilateral thickness changes; (3) the depths of all major left hemisphere sulci in the region were strongly positively related, whereas no such correlations were apparent in the right hemisphere; and (4) a leftward asymmetry in PaC thickness was specifically associated with better performance on a test of SWM ability. These findings highlight the complex relationship between variations in sulcal variability and cortical morphometry, and illustrate its potential functional implications.
Morphometric Correlates of Paracingulate Sulcus Variability
Volume and surface area
The “within‐hemisphere” analysis supported our predictions for grey matter volume and surface area, to the extent that the presence of a PCS in either hemisphere was associated with an increase in both in the PaC and decrease in both in the ACC (as has previously been demonstrated; Fornito et al., 2006; Paus et al., 1996b]. The “between‐hemisphere” analysis was generally consistent in that P/A and P/P individuals (i.e., those with a left PCS) displayed a similar pattern of differences relative to the A/A and A/P groups (i.e., those without a left PCS) in the left hemisphere, whereas P/A and A/A individuals (i.e., those without a right PCS) were more similar in the right hemisphere. Taken together, this suggests that possessing a PCS in one hemisphere influences grey matter volume and surface area in a manner largely independent of PCS variability in the other hemisphere. Although, minor exceptions to this general rule were noted in some ROIs, they are likely the result of variations in the course of the PCS and the region (dorsal or rostral) it runs through. The similarity between results obtained for volume and surface area suggests estimates of the former are largely driven by variations in the latter.
Cortical thickness
In contrast to volume and surface area, “within‐hemisphere” effects on thickness were confined to the left, such that the presence of a left PCS was associated with a specific increase in left PaC, but not ACC, thickness, with no comparable effects being identified in the right hemisphere. As predicted, the “between‐hemisphere” analysis revealed that the leftward asymmetric (P/A) individuals displayed a distinctive pattern of bilateral thickness variations characterized by significant increases in both left PaC and right ACC thickness relative to individuals without a left PCS (i.e., A/A and A/P individuals). P/P individuals did not differ from any of the groups, although Figure 4 suggests they displayed a similar pattern of thickness variations to the P/A group. Thus, the current findings indicate that while a PCS in the left hemisphere is associated with relatively increased left PaC and right ACC thickness, the reverse is not true for a PCS in the right hemisphere; A/A and A/P showed only small (d ∼ 0.3) thickness increases in the left ACC, and were actually (nonsignificantly) thinner in the right PaC when compared with P/A and P/P individuals.
Our analysis of thresholded ROIs examining the effect of PCS variability on thickness in sulcal regions provided some evidence to suggest these relationships were not an artifact of our parcellation protocol. Despite being somewhat limited in that the thresholded PaC ROI comprised the dorsal bank of the CS and ventral bank of the PCS in “present” cases but only the former area in “absent” cases, the analysis still indicated a moderate effect (d = 0.435, P = 0.077) of PCS incidence. Furthermore, this potential confound cannot explain why a left PCS was also associated with increased right ACC thickness and why the opposite pattern was not observed with respect to right PCS incidence. Our comparison of “present” versus “prominent” cases also indicated that the influence of variability in PCS extent not accounted for by our categorical approach was minimal, as no significant differences in PaC thickness were identified between these groups in either hemisphere. Together, this suggests our results are not an artifact of our parcellation and classification protocols, although more subtle effects could not be ruled out. Future work that examines how both categorical and continuous measures of PCS variability are related to the thickness of different parts of the sulcal/gyral formation (i.e., fundus, wall, crown) will be useful for characterizing these relationships further.
The finding that a PCS was associated with increased PaC thickness is partially consistent with the report of Thompson et al. [2005] that increased cortical complexity in the ACC/PaC area is positively correlated with regional thickness. The major difference is that Thompson and colleagues only found this association in the right hemisphere, while our results suggest the correlation should be left‐lateralized. Direct comparison between our findings is complicated by differences in the measures used to estimate cortical folding and the unknown frequency of a PCS in their sample. Many models of gyrification [Toro and Burnod, 2005; Welker, 1990] posit that thinner cortex should be associated with increased cortical folding, consistent with observations that human conditions such as polymicrogyria are associated with a relative thinning of cortex [Piao et al., 2004] and lissencephalic species tend to have thicker cortex [Welker, 1990]. Why the PaC should specifically break from this pattern is unclear. Because of its relatively late development and variable nature, the PCS has been labeled a tertiary sulcus [Chi et al., 1977; Paus et al., 1996a]. Tertiary sulci appear to be under less genetic control than primary sulci [Lohmann et al., 1999], suggesting their appearance is the result of environmental factors or the mechanical buckling of thinner cortical regions [Richman et al., 1975; Toro and Burnod, 2005] occurring after the emergence of surrounding primary structures (e.g., the CS). However, the rostro‐caudal extent of the PCS can vary considerably (from absent to >100 mm), and is associated with a large expansion in PaC surface area [Vogt et al., 1995] that presumably reflects the influence of developmental processes occurring in the proliferative zone early in gestation, prior to and during the formation of cortical convolutions [Hilgetag and Barbas, 2005; Rakic, 1988, 1994]. Thus, polygenic or epigenetic influences may play a more prominent role in determining the appearance of this sulcus, which recent evidence—and the findings described herein—suggest have important implications for understanding both individual differences in cognition and the emergence of psychiatric conditions [Artiges et al., 2006; Crosson et al., 1999; Fornito et al., 2004, 2006a; Le Provost et al., 2003; Yücel et al., 2002a, b; 2003].
Sulcal depth
We found no evidence for an effect of PCS variability on CS depth, in contrast to previous qualitative observations by Ono et al. [1990] and Vogt et al. [1995], but there was a striking dissociation between hemispheres with respect to the inter‐correlations of CS, PCS, and SRS depth. While all three left hemisphere sulci were strongly and positively correlated, no such relationships were found for their right hemisphere counterparts. Toro and Burnod [2005] have recently proposed a model for the development of cortical convolutions that suggests they result from outward expansion or growth of the cortical sheet, with sulcal depth being determined by regional anisotropies in the expansion force exerted on the cortex during development. In this regard, the left ACC/PaC region may undergo more uniform growth than the right, causing the development of sulci in the region to be more closely related. In one twin study, Tramo et al. [1995] found that the surface area of left hemisphere regions was under tighter genetic control than their right hemisphere counterparts. While others [Thompson et al., 2001; Wright et al., 2002] have not found evidence for lateralized genetic effects on cortical anatomy, all studies to date have used relatively coarse morphometric indices and have not examined the ACC or PaC in great detail, making it difficult to draw firm conclusions. It is possible, however, that stronger genetic influences on the sulcal/gyral morphology of the left medial frontal cortex may explain why the PCS is more frequently found in the left hemisphere [Paus et al., 1996b; Yücel et al., 2001]. Further study of genetic contributions to cortical folding patterns, and how these relate to regional variations in cortical thickness, will be important for clarifying the determinants of sulcal and gyral variability.
Functional Consequences of Paracingulate Sulcus Variability
While our previous work [Fornito et al., 2004] has demonstrated that PCS asymmetries are related to both SWM and VF performance, our current results indicate that a leftward asymmetry in PaC thickness is associated with better performance specifically on the SWM task. This suggests that the effect of PCS variability on cognitive performance may have distinct neurobiological underpinnings across verbal and spatial domains. Thus, while a leftward PCS asymmetry may be associated with better SWM performance because of changes to the underlying PaC grey matter, it may be associated with better VF performance due to differences in the connections the region has with other task‐relevant areas, following evidence that variations in cortical folding are associated with changes in regional connectivity profiles [see Fornito et al., 2004, for an expanded discussion; Scannell, 1997; Van Essen, 1997]. Given that a leftward PCS asymmetry has also been associated with better SWM performance in patients with schizophrenia [Fornito et al., 2006], and such patients are less likely to show this asymmetry [Le Provost et al., 2003; Yücel et al., 2002b], an interesting avenue of future research will be to determine whether PaC thickness asymmetries are also related to SWM performance in this population.
Interestingly, cortical thickness was the only metric associated with cognitive performance; no such relationships were observed for grey matter volume, surface area, or sulcal depth. This finding is consistent with a growing literature demonstrating relationships between regional variations in cortical thickness and cognitive abilities [Fjell et al., 2006; e.g., Milad et al., 2005; Shaw et al., 2006], and suggests that it may be a more functionally relevant neuroanatomical measure for characterizing brain structure–function associations. However, MRI‐based measures of cortical thickness reflect the summation of several cellular characteristics, including the number and density of neurons, glia, and their processes, and as noted by others [Paus et al., 2001; Sowell et al., 2004], may also be affected by the degree of regional myelination, which makes it difficult to determine the specific cellular change underlying cognitive‐anatomical associations such as those reported herein. Future work using concurrent diffusion‐weighted and spectroscopic imaging techniques that provide information regarding microscopic tissue properties will facilitate better understanding of the cellular changes mediating the relationship between sulcal variability and cognitive performance.
Neuroimaging Implications
It is common‐practice in structural and functional neuroimaging studies to attempt to minimize or “average‐out” inter‐individual variations in sulcal anatomy through spatial normalization to a standard template space. This is problematic when comparing two or more groups of individuals, since systematic population differences in cortical folding patterns [Hardan et al., 2004; Kippenhan et al., 2005; Thompson et al., 2005; Yücel et al., 2002b] may lead to errors in image registration, resulting in potentially spurious statistical results. Over and above this, the complex bilateral relationship between PCS variability and morphometry of the ACC and PaC identified in this study suggests that voxel‐based approaches to studying various parameters of anatomical integrity [e.g., Ashburner and Friston, 2000; Good et al., 2001; Thompson et al., 2004] should be followed‐up with careful ROI work that considers sulcal variability to ensure the findings are not an artifact of group differences in cortical folding patterns.
Limitations
We examined SWM and VF performance to extend our previous work demonstrating a relationship between PCS variability and cognitive performance [Fornito et al., 2004, 2006b], although the complex and multifactorial nature of these tasks makes it difficult to identify which specific cognitive processes might be related to PCS and PaC thickness asymmetries. Future work employing more specific cognitive paradigms and functional MRI to investigate these effects in more detail will be an important avenue of future research. Similarly, our investigation was focused on the effects of PCS variability in light of previous research efforts [Artiges et al., 2006; Crosson et al., 1999; Fornito et al., 2004; Heckers et al., 2004; Paus et al., 1996a, b; Yücel et al., 2001, 2002b, 2003] and we did not examine variations in SRS morphology. Categorizing people based on their sex and combined PCS and SRS morphology would require quite large samples, but would represent an important goal for future work.
Cortical thickness and sulcal depth estimates have been shown to vary with age [Kochunov et al., 2005; Salat et al., 2004; Shaw et al., 2006; Sowell et al., 2004], but such effects were not of primary interest in the current study. Our PCS groups were well matched for age and intelligence, suggesting group differences in these characteristics are unlikely to have confounded out results. Sex did not interact with PCS morphology on any of the morphometric variables, suggesting comparable effects across males and females. However, our power to detect such interactions was limited and larger samples would be required to test such interactions more comprehensively.
CONCLUSIONS
In summary, we have demonstrated that individuals with a leftward PCS asymmetry display a distinct profile of bilateral changes in cortical thickness that is related to their performance advantage on tests of executive cognition, particularly SWM. Future work using concurrent functional, structural, and diffusion‐weighted imaging techniques will further clarify the complex relationship between cortical folding variations and regional morphometry, and facilitate characterization of its functional consequences.
Supporting information
This article contains supplementary material available via the Internet at http://www.interscience.wiley.com/jpages/1065-9471/suppmat
Acknowledgements
Neuroimaging analysis was facilitated by the Neuropsychiatry Imaging Laboratory managed by Ms Bridget Soulsby at the Melbourne Neuropsychiatry Centre and supported by Neurosciences Victoria. AF was supported by an Australian Postgraduate Award and a JN Peters Research Fellowship.
REFERENCES
- Amodio DM, Frith CD ( 2006): Meeting of minds: The medial frontal cortex and social cognition. Nat Rev Neurosci 7: 268–277. [DOI] [PubMed] [Google Scholar]
- Artiges E, Martelli C, Naccache L, Bartres‐Faz D, Leprovost JB, Viard A, Paillere‐Martinot ML, Dehaene S, Martinot JL ( 2006): Paracingulate sulcus morphology and fMRI activation detection in schizophrenia patients. Schizophr Res 82: 143–151. [DOI] [PubMed] [Google Scholar]
- Ashburner J, Friston KJ ( 2000): Voxel‐based morphometry‐the methods. Neuroimage 11(6 Part 1): 805–821. [DOI] [PubMed] [Google Scholar]
- Behrens JT ( 1997): Principles and procedures of exploratory data analysis. Psychol Methods 2: 131–160. [Google Scholar]
- Benes FM ( 1996): The defects of affect and attention in schizophrenia: A possible neuroanatomical substrate In: Matthysse S, Levy DL, Kagan J, Benes FM, editors. Psychopathology: The Evolving Science of Mental Disorder. New York: Cambridge University Press; pp 127–151. [Google Scholar]
- Bush G, Luu P, Posner MI ( 2000): Cognitive and emotional influences in anterior cingulate cortex. Trends Cogn Sci 4: 215–222. [DOI] [PubMed] [Google Scholar]
- Chi JG, Dooling EC, Gilles FH ( 1977): Gyral development in the human brain. Ann Neurol 1: 86–93. [DOI] [PubMed] [Google Scholar]
- Cohen J ( 1992): A power primer. Psychol Bull 112: 155–159. [DOI] [PubMed] [Google Scholar]
- Crosson B, Sadek JR, Bobholz JA, Gökçay D, Mohr CM, Leonard CM, Maron L, Auerbach EJ, Browd SR, Freeman AJ, Briggs RW ( 1999): Activity in the paracingulate and cingulate sulci during word generation: An fMRI study of functional anatomy. Cereb Cortex 9: 307–316. [DOI] [PubMed] [Google Scholar]
- Dale AM, Fischl B, Sereno MI ( 1999): Cortical surface‐based analysis. I. Segmentation and surface reconstruction. Neuroimage 9: 179–194. [DOI] [PubMed] [Google Scholar]
- Davidson RJ, Pizzagalli D, Nitschke JB, Putnam K ( 2002): Depression: Perspectives from affective neuroscience. Annu Rev Psychol 53: 545–574. [DOI] [PubMed] [Google Scholar]
- Devinsky O, Morrell MJ, Vogt BA ( 1995): Contributions of anterior cingulate cortex to behaviour. Brain 118: 279–306. [DOI] [PubMed] [Google Scholar]
- Drevets WC, Price JL, Simpson JR Jr, Todd RD, Reich T, Vannier M, Raichle ME ( 1997): Subgenual prefrontal cortex abnormalities in mood disorders. Nature 386: 824–827. [DOI] [PubMed] [Google Scholar]
- Drevets WC, Ongur D, Price JL ( 1998): Neuroimaging abnormalities in the subgenual prefrontal cortex: Implications for the pathophysiology of familial mood disorders. Mol Psychiatry 3: 220–226, 190–191. [DOI] [PubMed] [Google Scholar]
- Eritaia J, Wood SJ, Stuart GW, Bridle N, Dudgeon P, Maruff P, Velakoulis D, Pantelis C ( 2000): An optimized method for estimating intracranial volume from magnetic resonance images. Magn Reson Med 44: 973–977. [DOI] [PubMed] [Google Scholar]
- Fischl B, Dale AM ( 2000): Measuring the thickness of the human cerebral cortex from magentic resonance images. Proc Natl Acad Sci USA 97: 11050–11055. [DOI] [PMC free article] [PubMed] [Google Scholar]
- Fischl B, Sereno MI, Dale AM ( 1999): Cortical surface‐based analysis. II. Inflation, flattening, and a surface‐based coordinate system. Neuroimage 9: 195–207. [DOI] [PubMed] [Google Scholar]
- Fjell AM, Walhovd KB, Reinvang I, Lundervold A, Salat D, Quinn BT, Fischl B, Dale AM ( 2006): Selective increase of cortical thickness in high‐performing elderly–structural indices of optimal cognitive aging. Neuroimage 29: 984–994. [DOI] [PubMed] [Google Scholar]
- Fornito A, Yücel M, Wood SJ, Stuart GW, Buchanan J‐A, Proffitt T, Anderson V, Velakoulis D, Pantelis C ( 2004): Individual differences in anterior cingulate/paracingulate morphology are related to executive functions in healthy males. Cereb Cortex 14: 424–431. [DOI] [PubMed] [Google Scholar]
- Fornito A, Whittle S, Wood SJ, Velakoulis D, Pantelis C, Yucel M ( 2006a): The influence of sulcal variability on morphometry of the human anterior cingulate and paracingulate cortex. Neuroimage 33: 843–854. [DOI] [PubMed] [Google Scholar]
- Fornito A, Yucel M, Wood SJ, Proffitt T, McGorry PD, Velakoulis D, Pantelis C ( 2006b): Morphology of the paracingulate sulcus and executive cognition in schizophrenia. Schizophr Res 88: 192–197. [DOI] [PubMed] [Google Scholar]
- Free SL, Bergin PS, Fish DR, Cook MJ, Shorvon SD, Stevens JM ( 1995): Methods for normalization of hippocampal volumes measured with MR. AJNR Am J Neuroradiol 16: 637–643. [PMC free article] [PubMed] [Google Scholar]
- Gardner W, Mulvey EP, Shaw EC ( 1995): Regression analyses of counts and rates: Poisson, overdispersed poisson, and negative binomial models. Psychol Bull 118: 392–404. [DOI] [PubMed] [Google Scholar]
- Good CD, Johnsrude IS, Ashburner J, Henson RN, Friston KJ, Frackowiak RS ( 2001): A voxel‐based morphometric study of ageing in 465 normal adult human brains. Neuroimage 14(1 Part 1): 21–36. [DOI] [PubMed] [Google Scholar]
- Hardan AY, Jou RJ, Keshavan MS, Varma R, Minshew NJ ( 2004): Increased frontal cortical folding in autism: A preliminary MRI study. Psychiatry Res 131: 263–268. [DOI] [PubMed] [Google Scholar]
- Heckers S, Weiss AP, Deckersbach T, Goff DC, Morecraft RJ, Bush G ( 2004): Anterior cingulate cortex activation during cognitive interference in schizophrenia. Am J Psychiatry 161: 707–715. [DOI] [PubMed] [Google Scholar]
- Hilgetag CC, Barbas H ( 2005): Developmental mechanics of the primate cerebral cortex. Anat Embryol (Berl) 210: 411–417. [DOI] [PubMed] [Google Scholar]
- Holmes CJ, Hoge R, Collins L, Woods R, Toga AW, Evans AC ( 1998): Enhancement of MR images using registration for signal averaging. J Comput Assist Tomogr 22: 324–333. [DOI] [PubMed] [Google Scholar]
- Im K, Lee JM, Yoon U, Shin YW, Hong SB, Kim IY, Kwon JS, Kim SI ( 2006): Fractal dimension in human cortical surface: Multiple regression analysis with cortical thickness, sulcal depth, and folding area. Hum Brain Mapp 27(12): 9941–1003. [DOI] [PMC free article] [PubMed] [Google Scholar]
- Jenkinson M, Smith S ( 2001): A global optimisation method for robust affine registration of brain images. Med Image Anal 5: 143–156. [DOI] [PubMed] [Google Scholar]
- Kippenhan JS, Olsen RK, Mervis CB, Morris CA, Kohn P, Meyer‐Lindenberg A, Berman KF ( 2005): Genetic contributions to human gyrification: Sulcal morphometry in Williams syndrome. J Neurosci 25: 7840–7846. [DOI] [PMC free article] [PubMed] [Google Scholar]
- Kochunov P, Mangin JF, Coyle T, Lancaster J, Thompson P, Riviere D, Cointepas Y, Regis J, Schlosser A, Royall DR, Zilles K, Mazziotta J, Toga A, Fox PT ( 2005): Age‐related morphology trends of cortical sulci. Hum Brain Mapp 26: 210–220. [DOI] [PMC free article] [PubMed] [Google Scholar]
- Le Provost JB, Bartres‐Faz D, Paillere‐Martinot ML, Artiges E, Pappata S, Recasens C, Perez‐Gomez M, Bernardo M, Baeza I, Bayle F, Martinot JL ( 2003): Paracingulate sulcus morphology in men with early‐onset schizophrenia. Br J Psychiatry 182: 228–232. [DOI] [PubMed] [Google Scholar]
- Liang K‐Y, Zeger S ( 1986): Longitudinal data analysis using generalized linear models. Biometrika 73: 13–22. [Google Scholar]
- Lohmann G, von Cramon DY, Steinmetz H ( 1999): Sulcal variability of twins. Cereb Cortex 9: 754–763. [DOI] [PubMed] [Google Scholar]
- Mega MS, Cummings JL ( 1997). The cingulate and cingulate syndromes In: Trimble MR, Cummings JL, editors. Contemporary Behavioural Neurology. Masschusetts: Butterworth‐Heinemann; pp 189–213. [Google Scholar]
- Milad MR, Quinn BT, Pitman RK, Orr SP, Fischl B, Rauch SL ( 2005): Thickness of ventromedial prefrontal cortex in humans is correlated with extinction memory. Proc Natl Acad Sci USA 102: 10706–10711. [DOI] [PMC free article] [PubMed] [Google Scholar]
- Miller MI, Hosakere M, Barker AR, Priebe CE, Lee N, Ratnanather JT, Wang L, Gado M, Morris JC, Csernansky JG ( 2003): Labeled cortical mantle distance maps of the cingulate quantify differences between dementia of the Alzhemier type and healthy aging. Proc Natl Acad Sci USA 100: 15172–15177. [DOI] [PMC free article] [PubMed] [Google Scholar]
- Nelson HE, Willison J ( 1991): National Adult Reading Test: Test manual. Windsor: NFER Nelson. [Google Scholar]
- Oldfield RC ( 1971): The assessment and analysis of handedness: The Edinburgh handedness inventory. Neuropsychologia 9: 97–114. [DOI] [PubMed] [Google Scholar]
- Ono M, Kubik S, Abernathy CD ( 1990): Atlas of the Cerebral Sulci. New York: Thieme. [Google Scholar]
- Owen AM, Downes JJ, Sahakian BJ, Polkey CE, Robbins TW ( 1990): Planning and spatial working memory following frontal lobes lesions in man. Neuropsychologia 28: 1021–1034. [DOI] [PubMed] [Google Scholar]
- Owen AM, Morris RG, Sahakian BJ, Polkey CE, Robbins TW ( 1996): Double dissociations of memory and executive functions in working memory tasks following frontal lobes excisions, temporal lobe excisions or amygdalo‐hippocampectomy in man. Brain 119: 1597–1615. [DOI] [PubMed] [Google Scholar]
- Paus T, Collins DL, Evans AC, Leonard G, Pike B, Zijdenbos A ( 2001): Maturation of white matter in the human brain: A review of magnetic resonance studies. Brain Res Bull 54: 255–266. [DOI] [PubMed] [Google Scholar]
- Paus T, Otkay N, Caramanos Z, MacDonald D, Zijdenbos A, D'Avirro D, Gutmans D, Holmes C, Tomaiuolo F, Evans AC ( 1996a): In vivo morphometry of the intrasulcal gray matter in the human cingulate, paracingulate, and superior rostral sulci: Hemispheric asymmetries, gender differences and probability maps. J Comp Neurol 376: 664–673. [DOI] [PubMed] [Google Scholar]
- Paus T, Tomaiuolo F, Otkay N, MacDonald D, Petrides M, Atlas J, Morris R, Evans AC ( 1996b): Human cingulate and paracingulate sulci: Pattern, variability, asymmetry, and probabilistic map. Cereb Cortex 6: 207–214. [DOI] [PubMed] [Google Scholar]
- Phan KL, Wager T, Taylor SF, Liberzon I ( 2002): Functional neuroanatomy of emotion: A meta‐analysis of emotion activation studies in PET and fMRI. Neuroimage 16: 331–348. [DOI] [PubMed] [Google Scholar]
- Piao X, Hill RS, Bodell A, Chang BS, Basel‐Vanagaite L, Straussberg R, Dobyns WB, Qasrawi B, Winter RM, Innes AM, Voit T, Ross ME, Michaud JL, Descarie JC, Barkovich AJ, Walsh CA ( 2004): G protein‐coupled receptor‐dependent development of human frontal cortex. Science 303: 2033–2036. [DOI] [PubMed] [Google Scholar]
- Picard N, Strick PL ( 1996): Motor areas of the medial wall: A review of their location and functional activation. Cereb Cortex 6: 342–353. [DOI] [PubMed] [Google Scholar]
- Rakic P ( 1988): Specification of cerebral cortical areas. Science 241: 170–176. [DOI] [PubMed] [Google Scholar]
- Rakic P ( 1994). Corticogenesis in human and nonhuman primates In: Gazzaniga MS, editor. The Conitive Neurosciences. London: The MIT Press; pp 127–145. [Google Scholar]
- Rettmann ME, Kraut MA, Prince JL, Resnick SM ( 2006): Cross‐sectional and longitudinal analyses of anatomical sulcal changes associated with aging. Cereb Cortex 16: 1584–1594. [DOI] [PubMed] [Google Scholar]
- Richman D, Stewart R, Hutchinson J, Caviness VJ ( 1975): Mechanical model of brain convolutional development. Science 189: 18–21. [DOI] [PubMed] [Google Scholar]
- Ridderinkhof KR, Ullsperger M, Crone EA, Nieuwenhuis S ( 2004): The role of the medial frontal cortex in cognitive control. Science 306: 443–447. [DOI] [PubMed] [Google Scholar]
- Salat DH, Buckner RL, Snyder AZ, Greve DN, Desikan RSR, Busa E, Morris JC, Dale AM, Fischl B ( 2004): Thinning of the cerebral cortex in aging. Cereb Cortex 14: 721–730. [DOI] [PubMed] [Google Scholar]
- Scannell JW ( 1997): Determining cortical landscapes. Nature 386: 452. [DOI] [PubMed] [Google Scholar]
- Shaw P, Greenstein D, Lerch J, Clasen L, Lenroot R, Gogtay N, Evans A, Rapoport J, Giedd J ( 2006): Intellectual ability and cortical development in children and adolescents. Nature 440: 676–679. [DOI] [PubMed] [Google Scholar]
- Smith SM ( 2002): Fast robust automated brain extraction. Hum Brain Mapp 17: 143–155. [DOI] [PMC free article] [PubMed] [Google Scholar]
- Sowell ER, Thompson PM, Leonard CM, Welcome SE, Kan E, Toga AW ( 2004): Longitudinal mapping of cortical thickness and brain growth in normal children. J Neurosci 24: 8223–8231. [DOI] [PMC free article] [PubMed] [Google Scholar]
- Spreen O, Strauss E ( 1998). A Compendium of Neuropsychological Tests: Administration, Norms and Commentary. New York: Oxford University Press. [Google Scholar]
- Steele JD, Lawrie SM ( 2004): Segregation of cognitive and emotional function in the prefrontal cortex: A stereotactic meta‐analysis. Neuroimage 21: 868–875. [DOI] [PubMed] [Google Scholar]
- Thompson PM, Cannon TD, Narr KL, Van Erp TGM, Poutanen V‐P, Huttunen M, Lönnqvist J, Standertskjöld‐Nordenstam CG, Kaprio J, Khaledy M, Dail R, Zoumalan CI, Toga AW ( 2001): Genetic influences on brain structure. Nature Neurosci 4: 1253–1258. [DOI] [PubMed] [Google Scholar]
- Thompson PM, Hayashi KM, Sowell ER, Gogtay N, Giedd JN, Rapoport JL, de Zubicaray GI, Janke AL, Rose SE, Semple J, Doddrell DM, Wang Y, van Erp TG, Cannon TD, Toga AW ( 2004): Mapping cortical change in Alzheimer's disease, brain development, and schizophrenia. Neuroimage 23( Suppl 1): S2–S18. [DOI] [PubMed] [Google Scholar]
- Thompson PM, Lee AD, Dutton RA, Geaga JA, Hayashi KM, Eckert MA, Bellugi U, Galaburda AM, Korenberg JR, Mills DL, Toga AW, Reiss AL ( 2005): Abnormal cortical complexity and thickness profiles mapped in Williams syndrome. J Neurosci 25: 4146–4158. [DOI] [PMC free article] [PubMed] [Google Scholar]
- Toro R, Burnod Y ( 2005): A morphogenetic model for the development of cortical convolutions. Cereb Cortex 15: 1900–1913. [DOI] [PubMed] [Google Scholar]
- Tramo MJ, Loftus WC, Thomas CE, Green RL, Mott LA, Gazzaniga MS ( 1995): Surface area of human cerebral cortex and its gross morphological subdivisions: In vivo measurments in monozygotic twins suggest differential hemisphere effects of genetic factors. J Cogn Neurosci 7: 292–301. [DOI] [PubMed] [Google Scholar]
- Van Essen DC ( 1997): A tension‐based theory of morphogenesis and compact wiring in the central nervous system. Nature 385: 313–318. [DOI] [PubMed] [Google Scholar]
- Van Essen DC ( 2005): A population‐average, landmark‐ and surface‐based (PALS) atlas of human cerebral cortex. Neuroimage 28: 635–662. [DOI] [PubMed] [Google Scholar]
- Van Essen DC, Drury HA, Joshi S, Miller MI ( 1998): Functional and structural mapping of human cerebral cortex: Solutions are in the surfaces. Proc Natl Acad Sci USA 95: 788–795. [DOI] [PMC free article] [PubMed] [Google Scholar]
- Vogt BA, Nimchinsky EA, Vogt LJ, Hof PR ( 1995): Human cingulate cortex: Surface features, flat maps, and cytoarchitecture. J Comp Neurol 359: 490–506. [DOI] [PubMed] [Google Scholar]
- Welker W ( 1990): Why does cerebral cortex fissure and fold? A review of determinants of sulci an gyri In: Jones EG, Peters A, editors. Cerebral Cortex. New York: Plenum Press; pp 3–136. [Google Scholar]
- Wright IC, Sham P, Murray RM, Weinberger DR, Bullmore ET ( 2002): Genetic contributions to regional variability in human brain structure: Methods and preliminary results. Neuroimage 17: 256–271. [DOI] [PubMed] [Google Scholar]
- Yücel M, Stuart GW, Maruff P, Velakoulis D, Crowe SF, Savage G, Pantelis C ( 2001): Hemispheric and gender‐related differences in the gross morphology of the anterior cingulate/paracingulate cortex in normal volunteers: An MRI morphometric study. Cereb Cortex 11: 17–25. [DOI] [PubMed] [Google Scholar]
- Yücel M, Pantelis C, Stuart GW, Wood SJ, Maruff P, Velakoulis D, Pipingas A, Crowe SF, Tochon‐Danguy HJ, Egan GF ( 2002a): Anterior cingulate activation during stroop task performance: A PET to MRI coregistration study of individual patients with schizophrenia. Am J Psychiatry 159: 251–254. [DOI] [PubMed] [Google Scholar]
- Yücel M, Stuart GW, Maruff P, Wood SJ, Savage GR, Smith DJ, Crowe SF, Copolov D, Velakoulis D, Pantelis C ( 2002b): Paracingulate morphologic differences in males with established schizophrenia: A magnetic resonance imaging morphopmetric study. Biol Psychiatry 52: 15–23. [DOI] [PubMed] [Google Scholar]
- Yücel M, Wood SJ, Phillips LJ, Stuart GW, Smith DJ, Yung A, Velakoulis D, McGorry PD, Velakoulis D ( 2003): Morphology of the anterior cingulate cortex in young men at ultra‐high risk of developing a psychotic illness. Brit J Psychiatry 182: 518–524. [DOI] [PubMed] [Google Scholar]
- Zeger S, Liang K‐Y ( 1986): Longitudinal data analysis for discrete and continuous outcomes. Biometrics 42: 121–130. [PubMed] [Google Scholar]
Associated Data
This section collects any data citations, data availability statements, or supplementary materials included in this article.
Supplementary Materials
This article contains supplementary material available via the Internet at http://www.interscience.wiley.com/jpages/1065-9471/suppmat