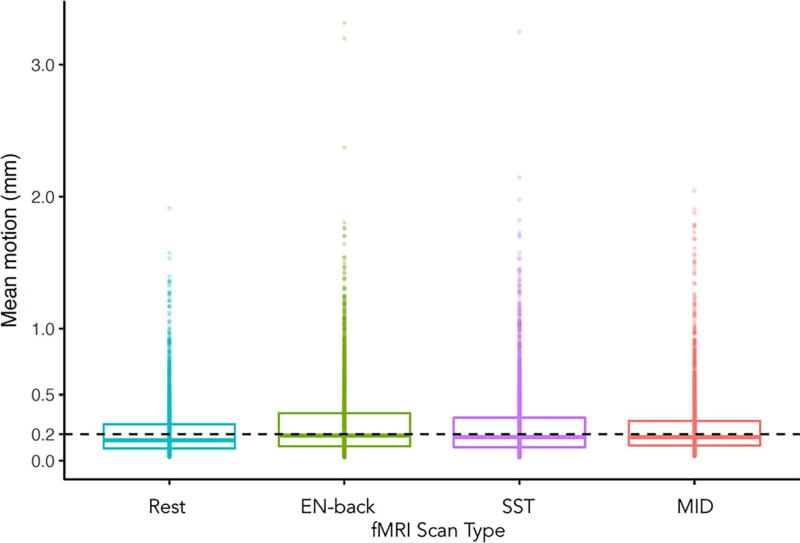
Fig. 2.
Preliminary distribution of head motion during resting-state and task-based fMRI scans. Box plots show the distribution of average frame-to-frame displacement during resting-state and emotion (E) N-back, stop-signal task (SST), and monetary incentive delay (MID) task runs from participants with all four scan types (n = 2536). The lower and upper box hinges correspond to the 25th and 75th percentiles; horizontal lines show median values; and dots represent individual participants.

